Fires are growing faster in the western United States. The fastest of them — termed ‘fast fires’ — often erupt near towns and account for most structural wildfire damage according to researchers who analyzed over 60,000 fires from 2001 to 2020. Read the illustrative graphic story.
Check out my other projects!

Period issues, including loss of menstruation, are often considered inconsequential but can signal serious...
0

New research backs up what gamers have thought for years: video games can be...

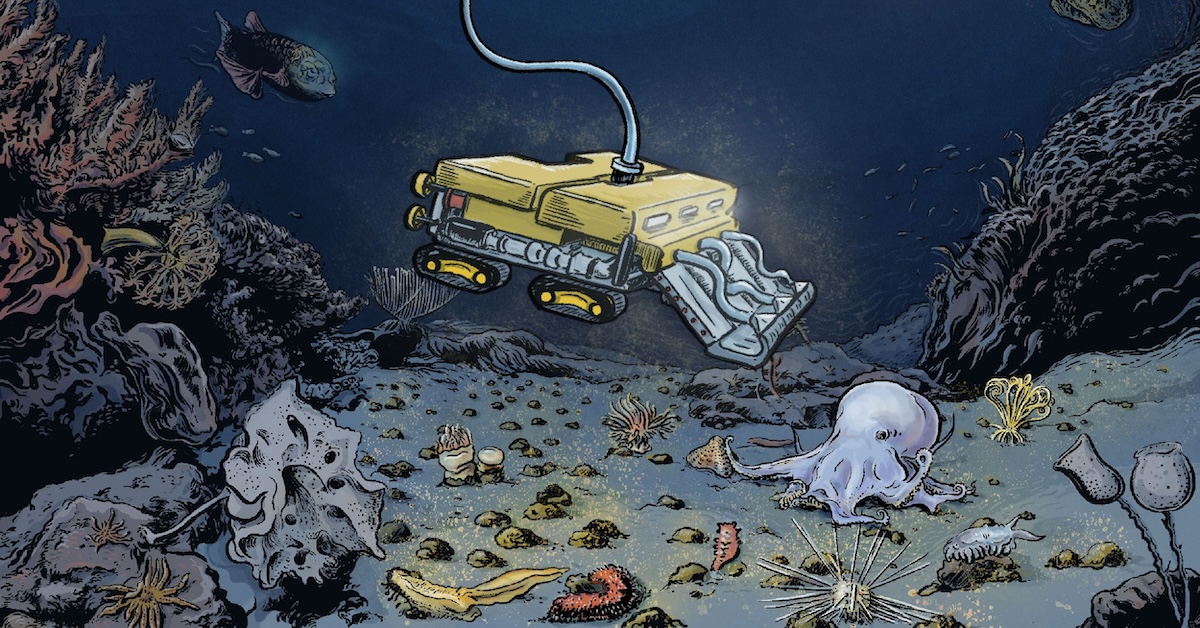
For a clean energy transition, should we mine the deep sea & risk potential...

Part 2 of Special Reports Fentanyl series, we illustrated the secretive route narcos use to...

Learn more at the interactive story "Fentanyl’s deadly chemistry: How rogue labs make opioids".
This...

Go to the interactive story "Why Plant Matters".
Visual interactive detailing the essential role plants...


Go to the interactive story "The cutting edge " to see how new drone technology...

Learn more at the interactive story "A Lifetime of Change".
To celebrate Earth day, Julia...

Check out how a crazy parasite controls the minds of its host to traveling...

Go to the interactive story "Don't waste food".
Most of us don’t know we waste...

So why is tossing food into a landfill so bad? Turns out there’s another...


What's at stake if we break the delicate balance of rainforests? Illustrated poster for...

Go to the interactive story "Toronto is home to the world’s largest lake-powered cooling...

Go to the interactive Mariah Carey dataviz story .
"IT'S TIIIIIIIIME!!!!!!❄️🎄 when the queen @mariahcarey...

Learn more at the interactive story "The risks posed by July Fourth fireworks".
To celebrate ...

Go to the interactive story "What’s on the Thanksgiving table in a hotter, drier...

Book illustration in collaboration with Dr. Howard Weiner. The book approaches solving the mystery...


Cover design proposal for Nature Biotechnology showing the metabolic pathways in a single cell...

Go to the interactive story "How Do We Get America Vaccinated? "
The interactive is a...


Go to the interactive dashboard "The US Maternal Vulnerability Index"
The US Maternal Vulnerability Index...

Go to the interactive dashboard "The UK Mental Health Data Explorer"
Why do so many...

During a 2020 DataViz conference, the Outlier, I realized how lacking Asian voices are...


Go to the interactive story "All the Ways to Make Bubble Tea, Taiwan's Pearl-fect...


Infographic revealing how trees "talk" to each other using a massive underground fungi network...


Infographic detailing the radical transformation of a caterpillar to a butterfly during metamorphosis. The...


Infographic revealing how spiders "fly" thousands of miles using the process called ballooning. New...


Data Visualization graphic showing how industrial farming is causing the plummeting of bird populations....


Infographic showing the new technology allowing scientists to identify key plant species honeybees visit...


Graphic showing elite climber Alex Honnold's climbing route he took on his legendary free...


Graphic showing various fish that can grow to monster-size. I created all illustrations using...


Infographic showing the evolutionary relationship of 31 small cat species revealed by most recent...


Visual explainer on a new process introduced by the Rice University lab of chemist...


Visual explainer on how carbon nanotube fibers bridge damaged heart to restore healthy beat.
The...


Data-driven graphics in collaboration with writer Kim Rogers about how the public and scientists...


Paleo illustrations and infographic showing the unexpected origin of fingers from fish fins to...


A two-page infographic detailing how refugees strengthen our economy and community. The project was...


Infographic revealing the archeological reconstruction and new findings of the functions and historical value...


Graphic showing why mammals are black and white. National Geographic Magazine Oct 2016.
Below shows...


Infographic revealing the key brain areas associated to brain death. Collaboration with graphic editor...


Data Visualization graphic showing the rapid growth of the space economy, which is predicted...


Data Visualization graphic showing how industrial farming is causing the plummeting of bird populations....

DataViz of how the Xylella bacterium may impact olive oil trade. Graphic for Scientific...

Graphic showing how a nanosensor works by detecting small amounts of genetic material. Researched,...

Watercolor painting of a bigfin reef squid, broadclub cuttlefish, giant pacific octopus and a...

Watercolor painting of a humpback whale, right whale, and sperm whale.
Whales have always held a...

Watercolor painting depicting the coat pattern change of Malayan Tapirs. All baby tapirs have...

Gouache painting of a honeybee pollinating jacob's ladder, and a bumblebee robbing nectar from...


Watercolor painting of pitcher plants (Nepenthes). These were illustrated at the Dr. Cecilia Koo Botanic...

Illustration design for Current Biology research article in 2013 about new findings that vegetables can...

Watercolor of the funkiest ficus leaf I've ever seen, Ficus Benghalensis Krishnae, found in...


"Trompe l'oeil" means "to trick the eye" in french. It is also an art...

Formosan Rock Macaques are the only native primates living in Taiwan, my home country....

These frogs are endemic to Taiwan. Illustrated with color pencil on film.
Check out my...

A piece of the beach at Monterey Bay. Illustrated with gouache.
Check out my other...

Created original illustrations with pen and ink of key species that are threatened by...

This is a collaborative project with Rice University immunology professor, Dr. Novotny, to create...

Concept illustration cover design submission for Neuron. The visual represents the cerebellum metaphorically as...


Two concept illustration cover designs conveying the dual "personality" of the microglia; the resting...